How a Sustainability SaaS Produces On-Brand Visuals for LinkedIn, Blog, and Email — Without a Designer
Verdant's 2-person marketing team creates stat cards, blog promos, and report visuals on-brand at scale. A playbook for any B2B team.
Every sustainability team has the same content problem.
You need a stat card for the quarterly emissions report going out Tuesday. A blog promo for the Scope 3 analysis publishing Wednesday. A customer quote for the case study launching Thursday. A report cover for the benchmark study releasing Friday. And the product team just shipped real-time carbon tracking, so add an announcement card.
That’s five distinct visuals. In Canva, each one takes 10–15 minutes — hunting for a template, adjusting brand greens that never match, nudging text alignment, exporting, realizing the amber is wrong, fixing it, re-exporting. Multiply by five. You just burned an hour on production work that doesn’t move pipeline.
Verdant — a sustainability analytics platform that helps mid-market companies track carbon footprint, ESG metrics, and progress toward climate goals — decided to stop losing that hour. Their marketing team is two people. They have no designer. Here’s the exact content they produce with ImageLayer, and how any sustainability-focused team can replicate the workflow.
Verdant’s brand system
Sustainability brands have a credibility problem online: lean too green and the visuals read as greenwashing clip-art. Verdant solves it with a restrained, report-grade look that they enforce through one set of brand instructions, pasted into the Additional notes field of each content type template — so an ESG metric card and a feature announcement always feel like the same publication.
Visual style: Clean, data-forward design with organic nature accents. Light cream backgrounds with soft sage-green gradient areas for warmth and depth. Subtle leaf-vein patterns and organic blob shapes at very low opacity for texture. Sophisticated infographic aesthetic — think premium ESG report, not corporate clip art.
Color palette:
- Forest Green
#1B4332— headlines, primary text, data elements - Warm Amber
#D4A843— accents, icons, quotation marks, divider lines - Cream
#FFF8F0— backgrounds - Pale Sage
#E8F5E9— gradient areas, soft background accents - Charcoal
#2D2D2D— secondary text
Typography: Clean geometric sans-serif — bold for metrics and section headers, regular for body. No serifs, no script, and no decorative weights that would undercut the report-grade tone.
Avoid: Dark/moody imagery, clip art, stock photo style, 3D renders, neon colors, glow effects on text, overly corporate aesthetics.
These instructions do the governance work that a brand team normally polices by hand. Anyone on the two-person marketing team pastes the same notes and the output lands on-brand — no review cycle, no “can you fix the green” Slack thread.
1. ESG metric cards
When Verdant has an ESG metric worth sharing, it needs to be on LinkedIn within minutes — not after a design request.
Content Type: Stat Highlight
Fields used:
- Metric Value: “34%”
- Metric Label: “reduction in carbon emissions”
- Context: “Across 340 enterprise customers in 2025”
- Additional notes: “Light cream background (#FFF8F0) with soft mesh gradient — gentle pools of pale sage green (#E8F5E9) and warm amber tint (#FFF3E0) for organic atmosphere. Number in deep forest green (#1B4332), huge, sharp, no glow or shadow effects. Faint downward-trending line chart in light sage behind the number. Subtle leaf-vein patterns at 2-3% opacity. Soft organic blob shapes in pale green for depth. Small ‘Verdant’ wordmark in forest green top-left.”
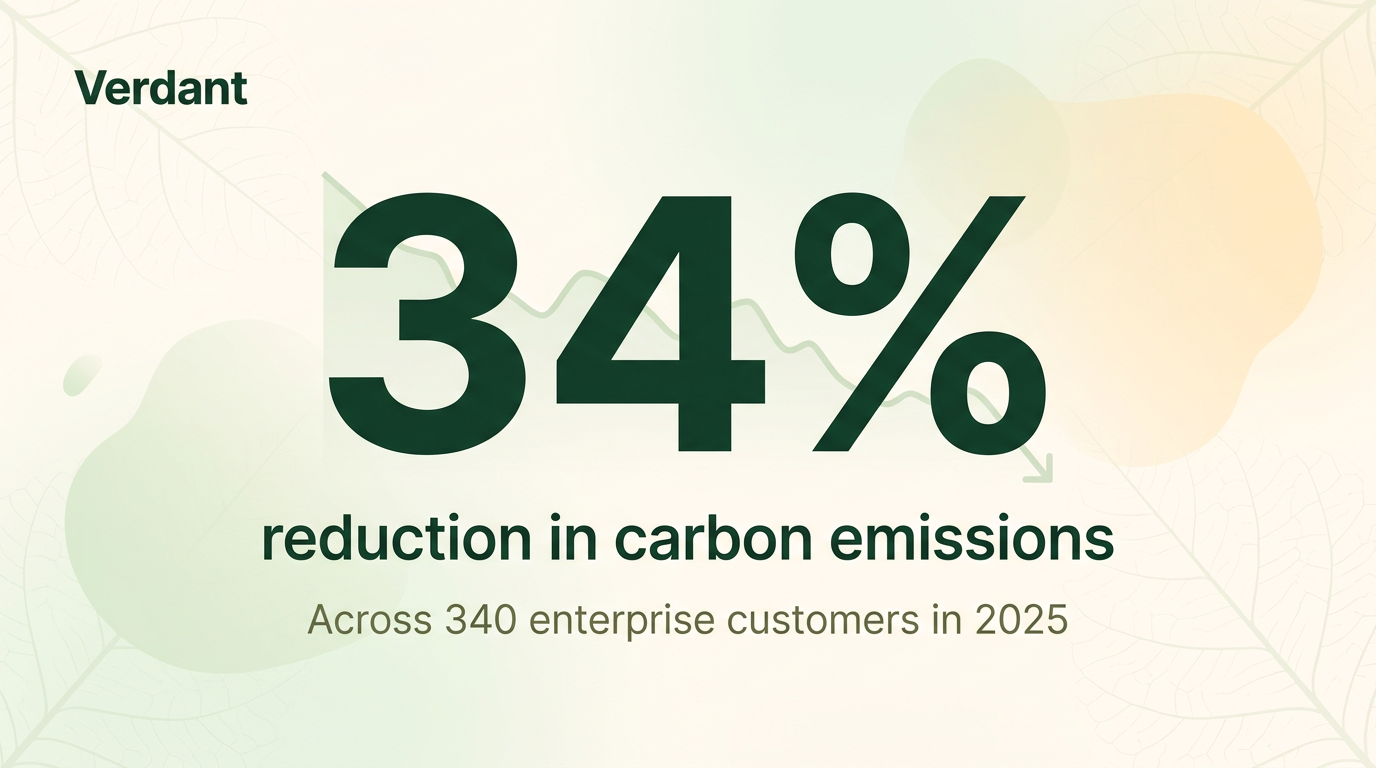
The number dominates. The sage gradient and leaf-vein texture add depth without competing with the data.
The number takes up half the image. The downward trend line behind it reinforces the reduction story before the viewer reads a word. The organic shapes and leaf-vein patterns add a subtle nature-forward feel that signals “sustainability” without being literal about it — no clip-art trees, no stock-photo wind turbines. This is the kind of content McKinsey Sustainability and BCG Green publish weekly. Verdant creates it in 30 seconds.
2. Scope-3 article promos
A sustainability article lives or dies on the strength of its data hook. Rather than ship LinkedIn’s bare link preview, Verdant pairs each post with a custom visual that surfaces the headline statistic — so the value is visible before anyone clicks through.
Content Type: Blog / Article Promo
Fields used:
- Article Title: “The Hidden Cost of Untracked Scope 3 Emissions”
- Key Takeaway: “Companies ignoring Scope 3 underestimate their carbon footprint by an average of 73%”
- Additional notes: “Light cream background with diagonal gradient sweep from bottom-right in pale sage and subtle amber warmth. ‘BLOG’ pill tag in warm amber (#D4A843) at top. Clean donut chart on right side showing 73% (forest green) vs 27% (amber) with labels. Faint organic wave patterns at 3% opacity. ‘Verdant’ wordmark bottom-left in forest green. ‘Read →’ CTA in amber bottom-right. Clean editorial design. All text sharp, no glow.”
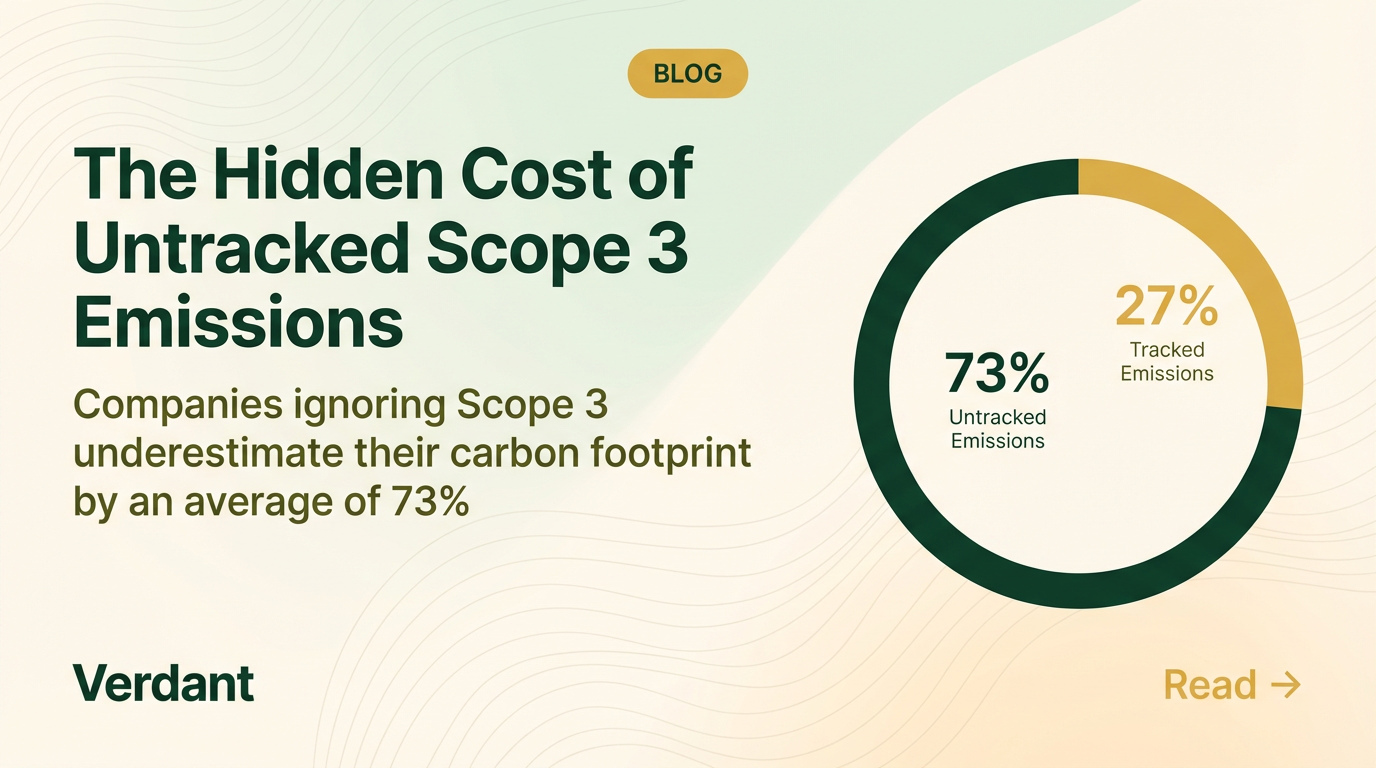
The donut chart gives readers a reason to click — the data tells the story before they read a word.
The “BLOG” pill signals content type instantly. The donut chart comparison provides value in the image itself — the reader learns something just by looking at it. That’s what earns engagement on LinkedIn: images that teach, not just images that decorate. The warm amber and sage-green gradient areas create visual interest without overwhelming the cream base.
3. Customer outcome quotes
When Verdant’s customers share results, those testimonials need to look professional and on-brand — not like a generic Canva template.
Content Type: Quote Card
Fields used:
- Quote: “Verdant replaced three spreadsheets and a part-time analyst. We now track emissions across 12 facilities in real time.”
- Author: “Maria Torres”
- Role: “VP Sustainability, NovaChem”
- Additional notes: “Light cream background (#FFF8F0) with soft radial gradient of pale sage green (#E8F5E9) in upper right area. Large decorative open-quotation marks in warm amber (#D4A843), flat, no glow. Quote text in deep forest green (#1B4332). Thin amber accent line below quote separating attribution. Delicate leaf-vein geometric lines at 2% opacity as texture. ‘Verdant’ wordmark bottom-right in forest green. Razor-sharp text.”
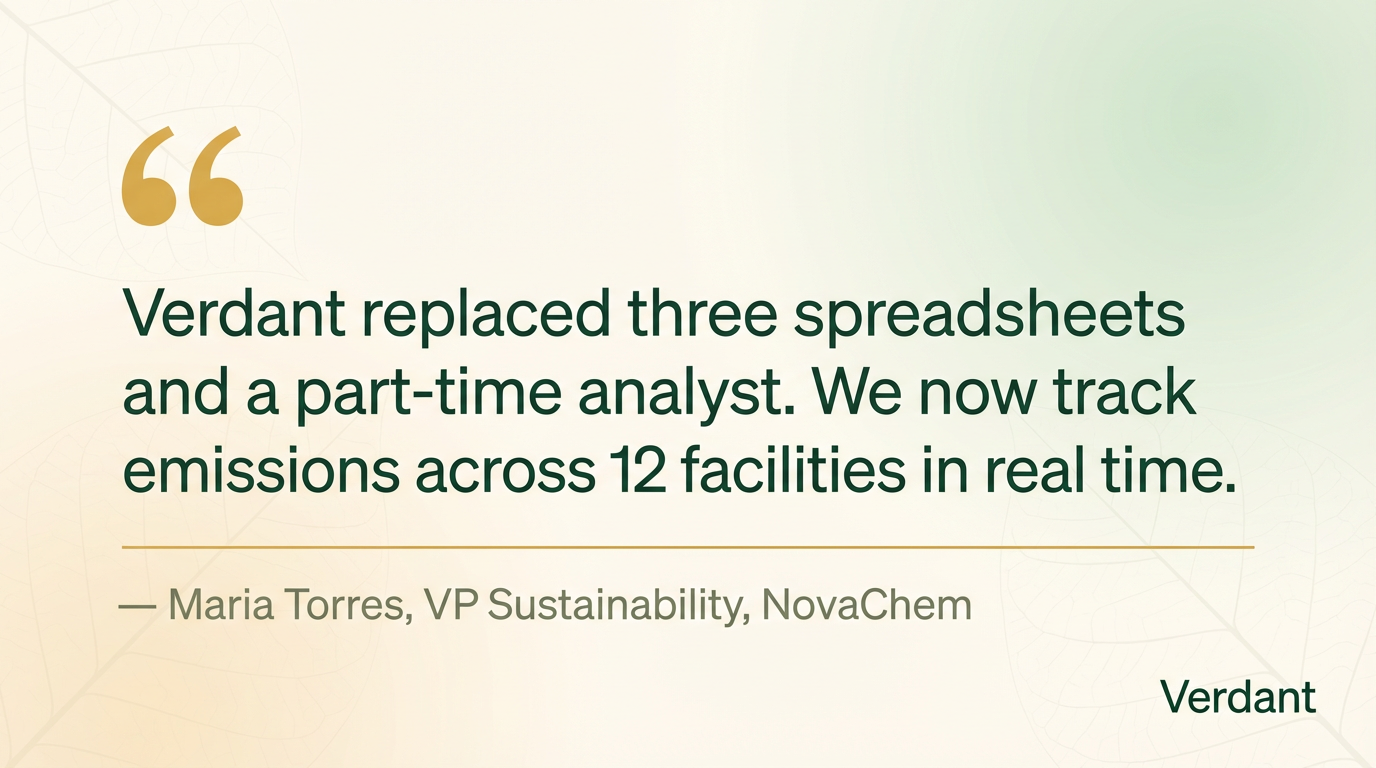
The amber quotation marks are the visual anchor — distinctive, branded, instantly recognizable.
The quote text is sized for in-feed reading: you don’t need to click to get the message. The amber quotation marks provide brand recognition — every Verdant quote card has the same visual signature. The sage-green gradient in the corner adds warmth and prevents the card from feeling flat. This is the format that makes testimonials actually get shared, not just liked.
4. Sustainability benchmark covers
Verdant publishes quarterly sustainability benchmark reports. Each needs a LinkedIn visual that signals “this is substantial research worth downloading.”
Content Type: General (freeform prompt)
Prompt used:
LinkedIn visual promoting the ‘2026 Sustainability Benchmark Report’ by Verdant. Light cream background (#FFF8F0) with soft sage green (#E8F5E9) gradient from left and subtle amber warmth. Left side: bold forest green (#1B4332) headline ‘2026 Sustainability Benchmark Report’ with subtitle ‘Key findings from 340 enterprise companies’ in muted olive text, small amber accent line underneath. Right side: white report cover mockup at slight 3D perspective angle with subtle shadow — cover shows clean data visualizations (bar charts in forest green and amber, circular gauge, trend lines) and ‘Verdant’ logo. Faint organic wave lines in background. ‘Verdant’ wordmark bottom-left. ‘Download →’ in amber bottom-right. Light, authoritative. All text sharp, no glow.
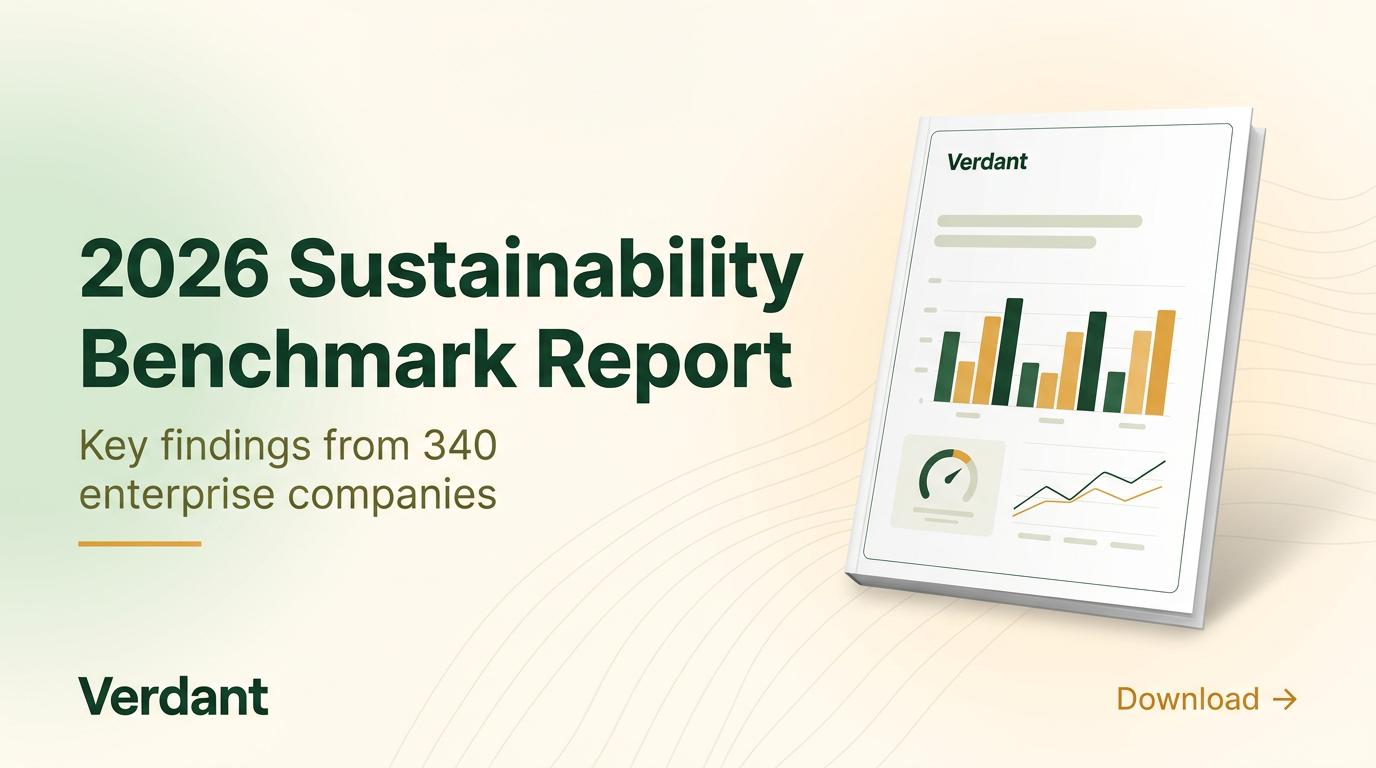
The perspective-angled cover creates legitimacy. The clean data viz on the cover reinforces the data-forward brand.
The 3D cover mockup makes the report feel tangible in a digital feed. The data visualizations on the cover use Verdant’s exact brand colors — forest green bars, amber accents — reinforcing the data-forward identity. The light background keeps the whole thing feeling open and accessible rather than dense and corporate.
5. Feature launch announcements
When Verdant ships a major feature, the LinkedIn post needs to match the energy of the release while staying on-brand.
Content Type: Announcement
Fields used:
- Headline: “Introducing Real-Time Carbon Tracking”
- Key Details: “Live Emissions Dashboard. Scope 1-2-3 Breakdown. Automated Reporting.”
- Additional notes: “Light cream background (#FFF8F0) with soft mesh gradient — gentle pools of pale sage green and warm amber tint. Headline in bold forest green (#1B4332), large, centered. Thin amber accent line separating headline from features. Three feature highlights in horizontal row with small line icons in amber (#D4A843). Subtle floating organic leaf-like shapes at low opacity in pale green for depth. Organic wave patterns at 3% opacity. ‘Verdant’ wordmark top-left. Razor-sharp text, no glow effects.”
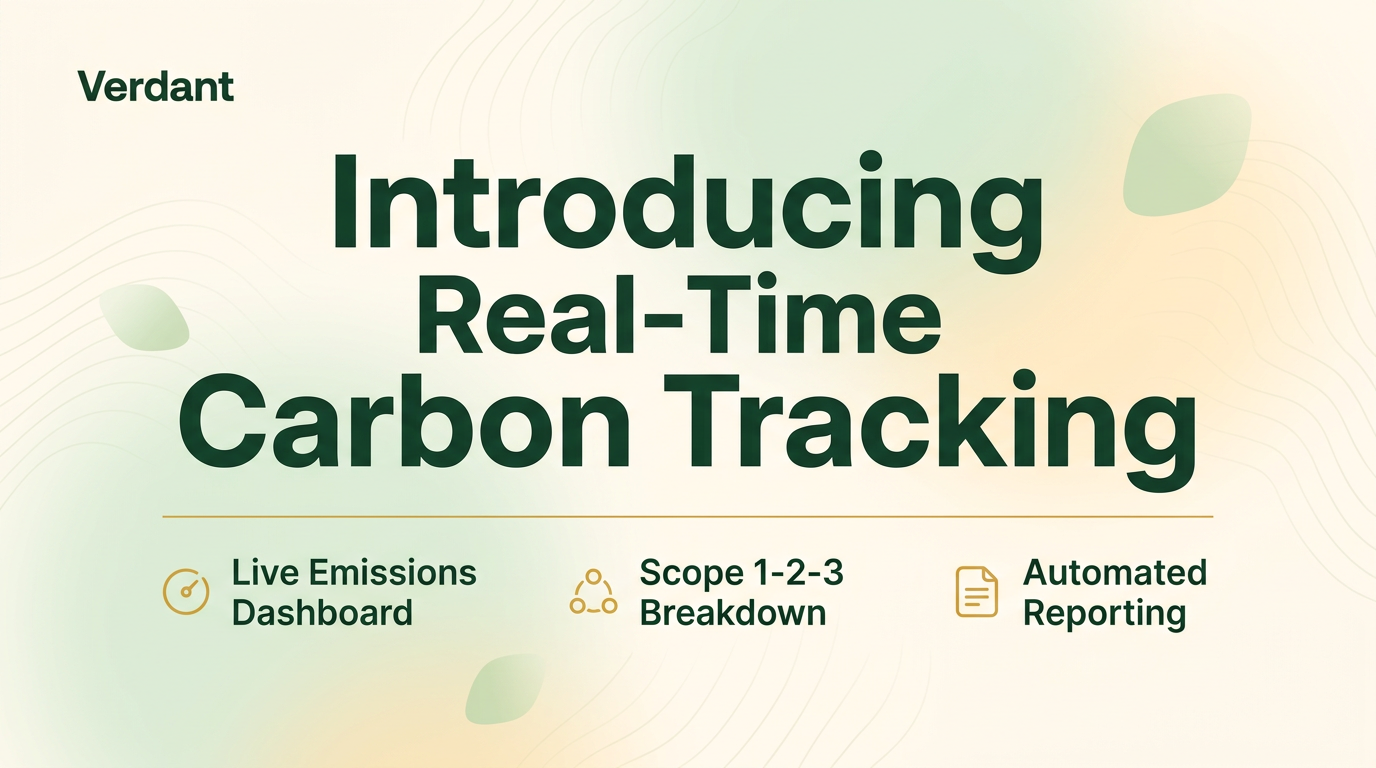
The three feature callouts give readers enough information to understand the release without clicking.
This is the most visually dynamic card in the set — and intentionally so. The floating leaf shapes add energy without breaking the light, clean aesthetic. The three feature callouts in a horizontal row give readers the key information at a glance. The amber icons tie the features back to the brand palette. This is the visual language you’d see from Watershed, Persefoni, or Sphera for product launches — except it took 60 seconds, not a design sprint.
The real difference: brand enforcement
Here’s where ImageLayer’s value becomes obvious. Same concept — “sustainability report visual” — generated two ways.
Without brand enforcement (what you get from a generic AI tool):
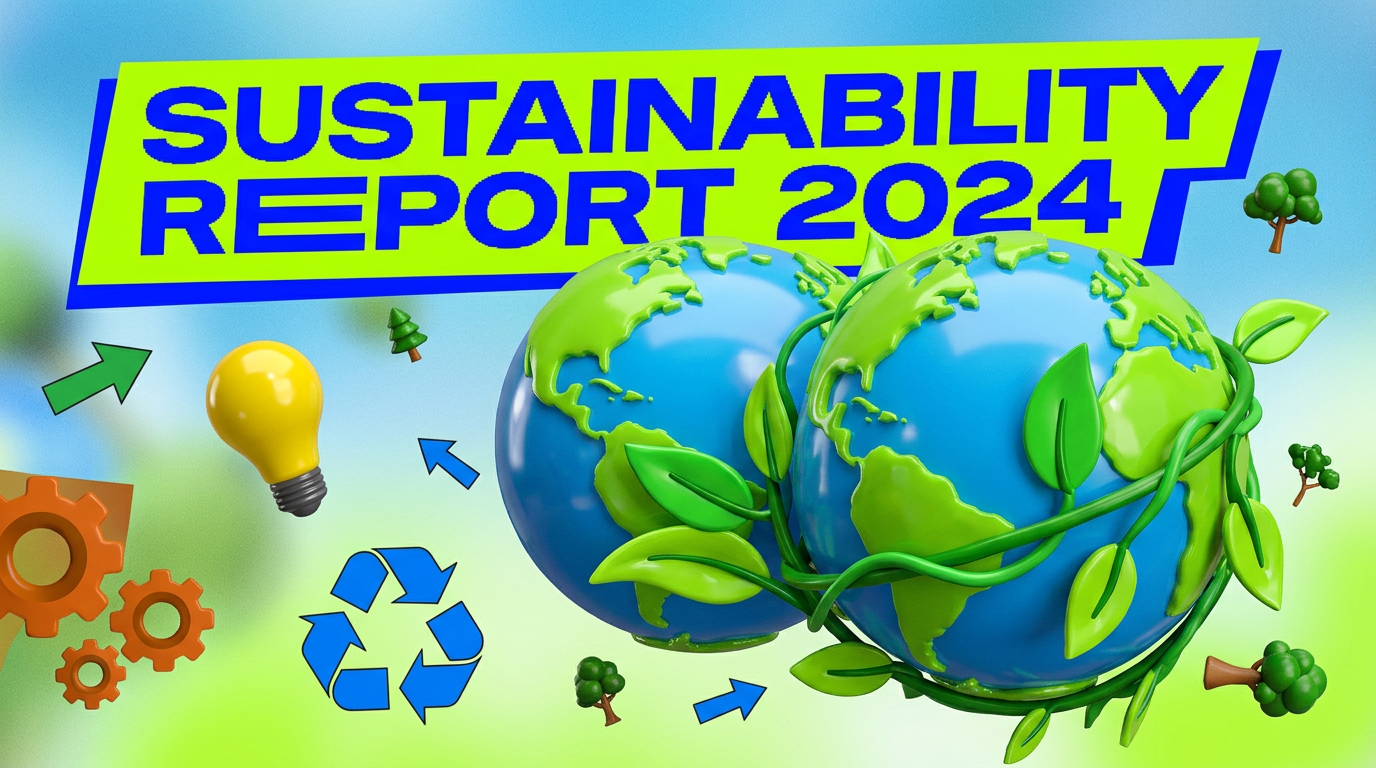
Glossy 3D globe. Neon yellow-green. Random clip art scattered around. A generic “SUSTAINABILITY REPORT 2024” banner slapped on top. This is what your users get when they go to ChatGPT and type “sustainability image.”
With Verdant’s brand kit applied:
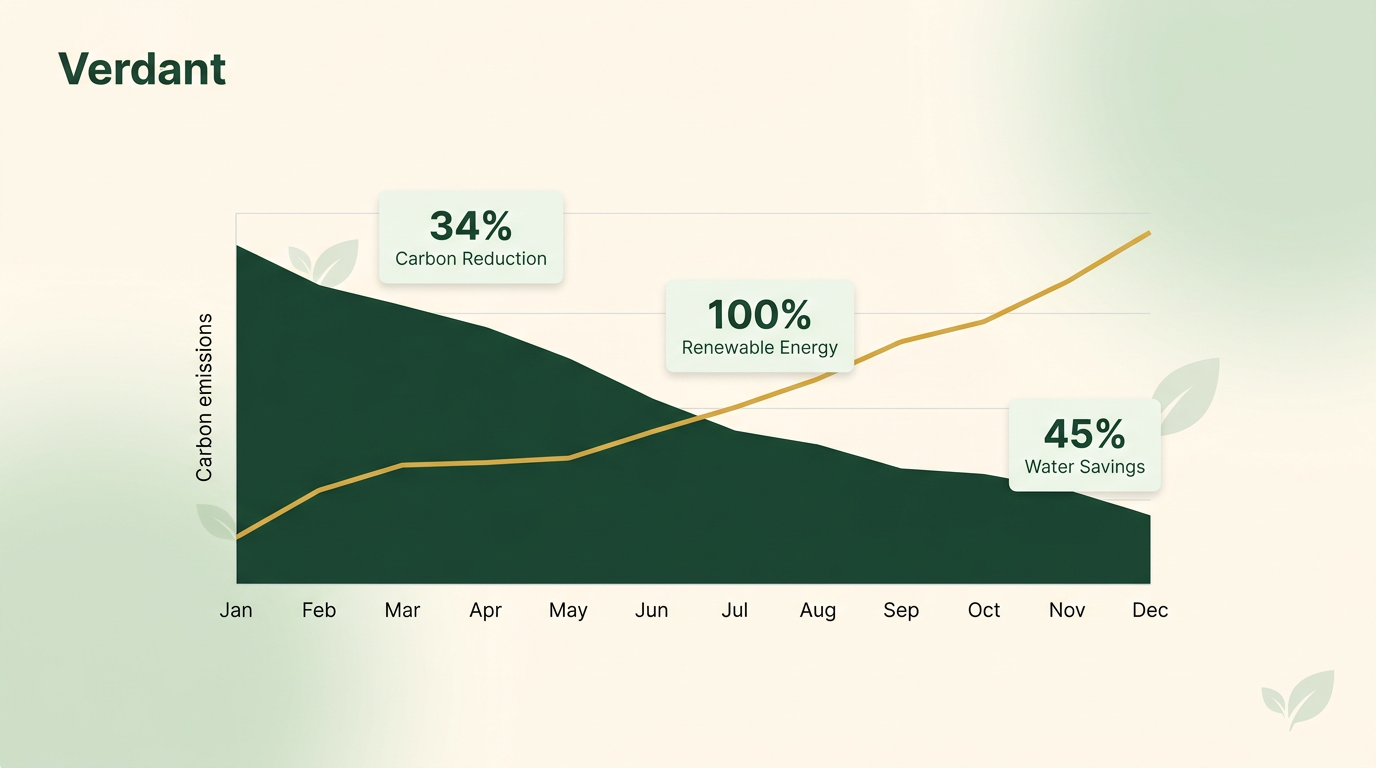
Same concept. Completely different output. The brand kit constrained the AI to Verdant’s color palette, visual style, and tone. Clean area chart showing emissions declining over time. Key metrics overlaid as small data cards. Leaf motifs integrated subtly. Every element uses the exact forest green and amber palette. It looks like something that belongs in Verdant’s annual report — not something pulled from a random AI generator.
What Verdant’s week looks like now
Monday through Friday, their two-person marketing team produces:
| Content type | Weekly volume | Time per asset |
|---|---|---|
| Stat highlights | 3 | ~30 seconds |
| Blog promos | 2 | ~45 seconds |
| Customer quote cards | 2 | ~30 seconds |
| Report / benchmark promos | 1 | ~60 seconds |
| Announcements | 1 | ~60 seconds |
Total: 9 branded visuals per week. Total production time: under 6 minutes.
In Canva, that’s 9 images × 12 minutes = nearly 2 hours per week. And with two people on the team, consistency is the first casualty — everyone picks slightly different greens, slightly different amber tones, slightly different background warmth.
The notes field eliminates the consistency problem entirely. One set of brand instructions. Paste it. Every image follows the same system regardless of who creates it.
A playbook you can copy
The lesson isn’t specific to sustainability. Any B2B team publishing on LinkedIn cycles through the same handful of formats — metric cards, article promos, customer quotes, report covers, launch announcements. What changes Verdant’s math is enforcement: the brand kit guarantees a two-person team ships on-brand work without a designer in the loop.
Write your visual rules down once — background, primary accent, gradient behavior, typography, and a firm avoid list (for Verdant, that avoid list is what keeps the output from sliding into greenwashing clip-art). Paste them into the Additional notes field and generate. The first asset proves the look; the third proves the speed.
Different industry, same engine: compare how a B2B social tool runs this for engagement content or how the same brand rules govern AI video. The configuration lives in your brand guidelines, and the use-cases library maps each format to a workflow.
Set up your brand kit and generate your first branded visual — it takes about five minutes.